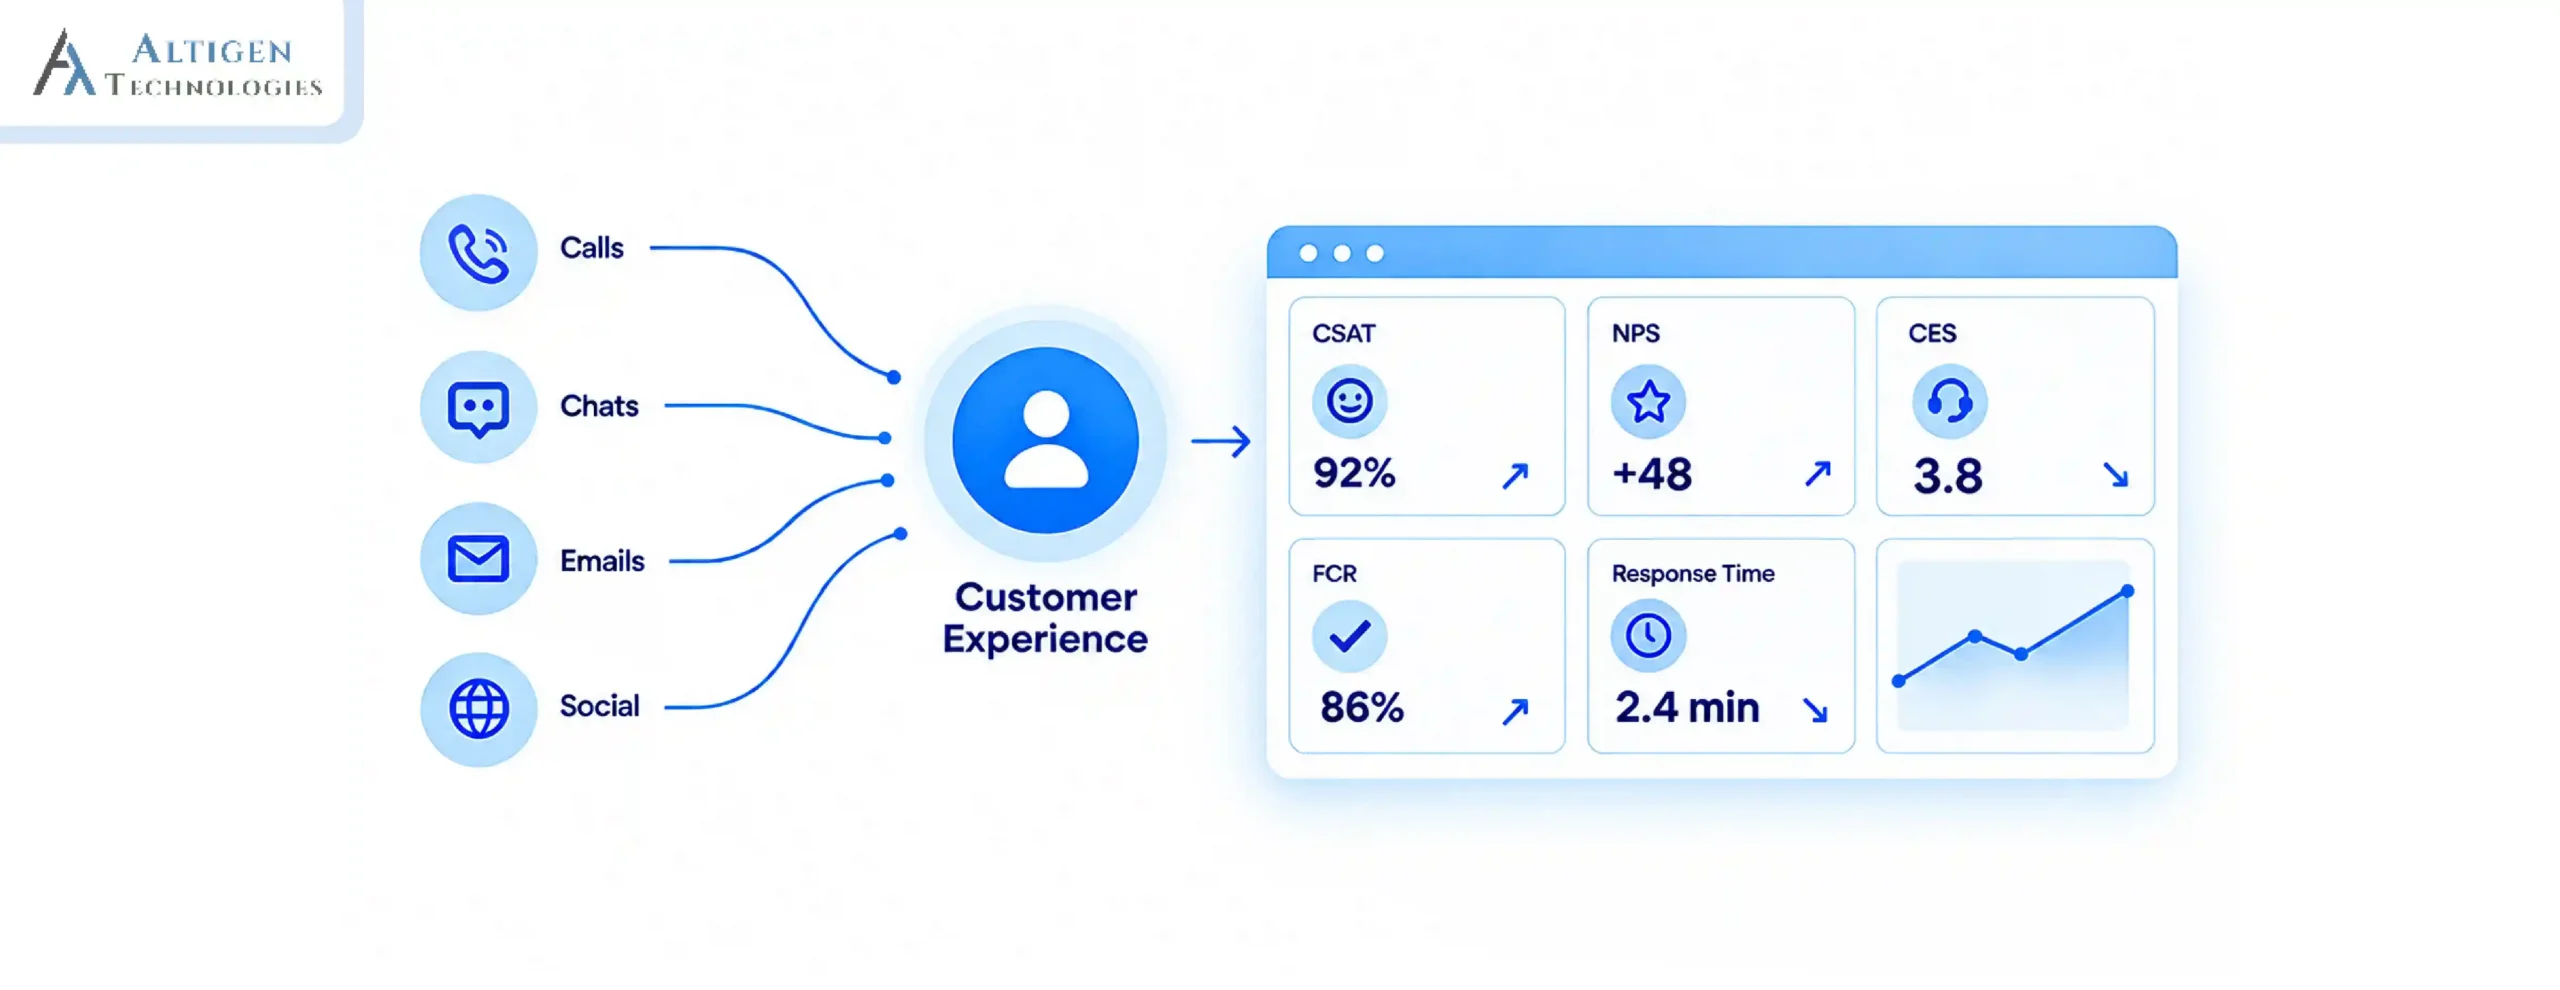
Twenty KPIs on the dashboard, a report goes out every Monday, yet your CX score hasn’t moved in three quarters. Does this sound familiar with your call center? This shows that tracking a number and acting on it are two different skills, and most teams stop at the first one.
Call center analytics helps you address this problem by telling you which numbers actually explain customer behavior and which ones only simply measure operational performance.
In this guide, we explain what call center analytics is, explore the metrics that directly impact customer experience, the ones that measure operational efficiency, and show how AI-powered call center software turns raw call data into actionable insights.
| TL;DR – A Quick Takeaway 1. Focus on outcome-driven metrics like FCR, CSAT, CES, and customer sentiment instead of treating every KPI as equally important. 2. Separate operational metrics from customer experience metrics to avoid optimizing efficiency at the expense of service quality. 3. Use AI-powered analytics to uncover the reasons behind declining CX, recurring customer issues, and agent performance gaps. 4. Turn raw call data into key insights with speech analytics, root-cause analysis, and AI-powered recommendations that improve customer experience and business performance. |
What is call center analytics and how is it different from reporting
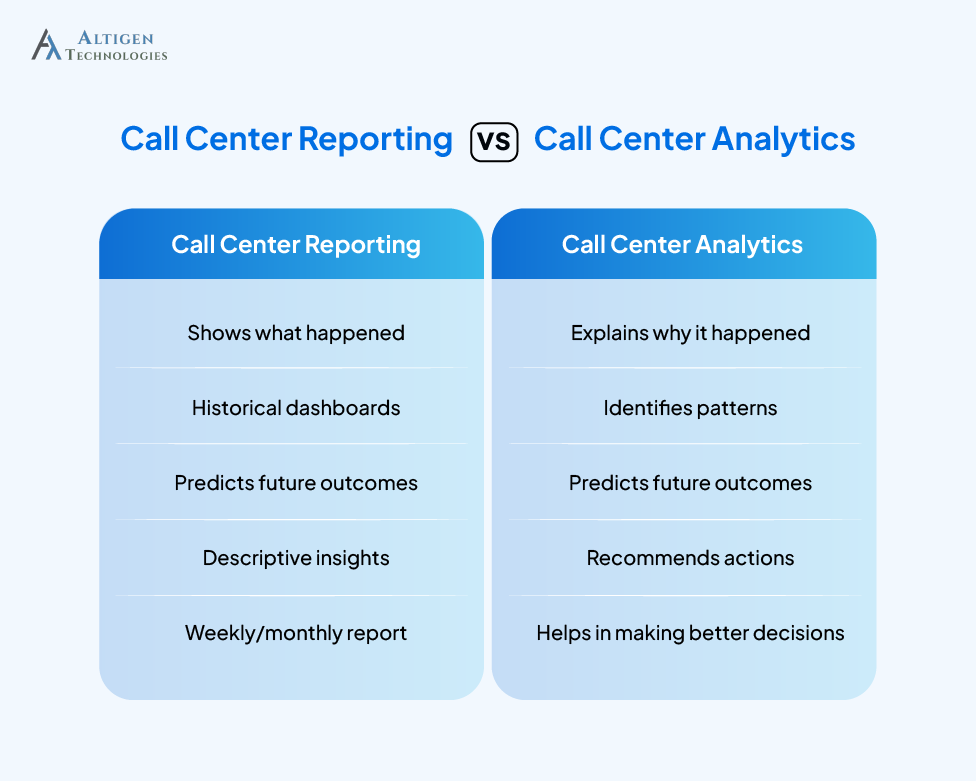
Call center analytics is the process of collecting and analyzing customer interaction data, agent performance, and operational metrics to improve service quality, efficiency, and business outcomes. Call center analytics and call center reporting are used as interchangeable terms, but they describe two different jobs.
Call center reporting tells you what happened, such as last week’s CSAT score, average speed of answer (ASA), or abandonment rate displayed on a dashboard. Reporting is descriptive, but it doesn’t explain why those numbers changed.
Call center analytics goes further and helps you know why a metric moved, and what you should do next. It provides:
- Diagnostic depth: why CSAT dropped or improved in a specific region or queue
- Pattern detection: which agents, scripts, or call reasons are driving repeat contact
- Prediction: which customers are at risk of churn based on sentiment trends, not just a single bad call
- Recommendation: what change (coaching, routing, knowledge base update) would actually move the number
What are the top call center metrics that improve customer experience
The top call center metrics that improve customer experience include customer satisfaction (CSAT), first call resolution (FCR), customer effort score (CES), customer sentiment, and other metrics that measure how effectively customer issues are resolved. These metrics can be grouped into four categories.
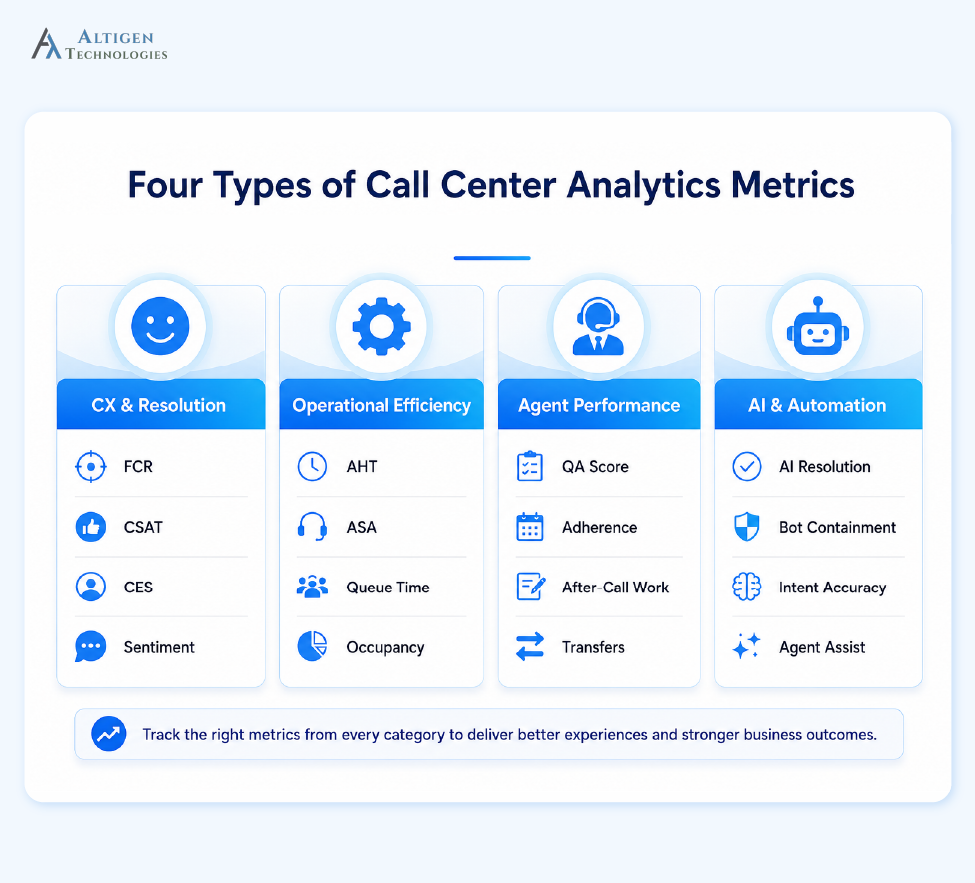
1. CX and resolution metrics
These metrics measure how effectively your call center resolves customer issues and how customers perceive the overall service experience.
- CSAT (Customer satisfaction score): It measures how a customer felt about a specific interaction
- NPS (Net promoter score): It measures loyalty and whether the customer will promote the product or service to others
- CES (Customer effort score): This captures how hard a customer had to work to get their issue resolved, usually a stronger churn predictor than CSAT alone
- Customer sentiment: Derived from call and chat conversations, it captures frustration that customers don’t always report.
- First call resolution (FCR): It is the percentage of issues resolved without a follow-up contact.
- Repeat contact rate: This is inverse of FCR, and one of the early warning signs that shows something in your process is ineffective.
- Escalation rate: It shows how often issues need a supervisor or specialist, which flags either training gaps or genuinely complex call types.
According to SQM Group research, the first-call resolution rate has a near one-to-one relationship with CSAT, and customer satisfaction drops by roughly 15 percent with each additional callback a customer has to make for the same issue.
2. Operational efficiency metrics
Operational efficiency metrics measure how efficiently your call center handles customer interactions, helping teams improve staffing, workflows, and service delivery.
- Average handle time (AHT): This means total time per interaction, including talk time, hold time, and after-call work
- Average speed of answer (ASA): It measures how long a customer waits before reaching an agent
- Queue time: This is the time spent waiting once a customer has been routed but before connecting with an available agent
- Abandonment rate: The percentage of customers who hang up before being served
- Occupancy: The percentage of scheduled time agents spend actively handling contacts
Suggested Reading: How Contact Center Management Software Reduces Agent Handle Time
3. Agent performance metrics
Agent performance metrics evaluate how effectively agents handle customer interactions, helping supervisors identify coaching opportunities, improve consistency, and provide better customer experiences.
- QA scores: Measures whether agents followed all quality standards during customer interactions.
- Schedule adherence: Reveals whether agents are logged in and available during their scheduled hours.
- After-call work: Time spent on documentation and follow-up tasks once a call ends.
- Agent utilization: Measures how much of an agent’s paid time is spent handling customer interactions versus other activities.
- Transfer rate: Calculates how often a call is transferred to another agent or department for skill gaps or poor routing.
4. AI and automation metrics
These metrics help contact centers to evaluate how well AI automates customer interactions while maintaining service quality and supporting human agents.
- Bot containment rate: Measures the share of interactions a virtual agent resolves without human involvement
- AI resolution rate: Measures how many interactions actually resolved to the customer’s satisfaction by AI-powered automated systems.
- AI transfer rate: How often the AI hands a conversation to a human agent, and at what point in the conversation
- Intent recognition accuracy: How reliably the AI correctly identifies what the customer is actually asking for
- Agent assist adoption: How often live agents use AI-suggested responses or knowledge recommendations during a call.
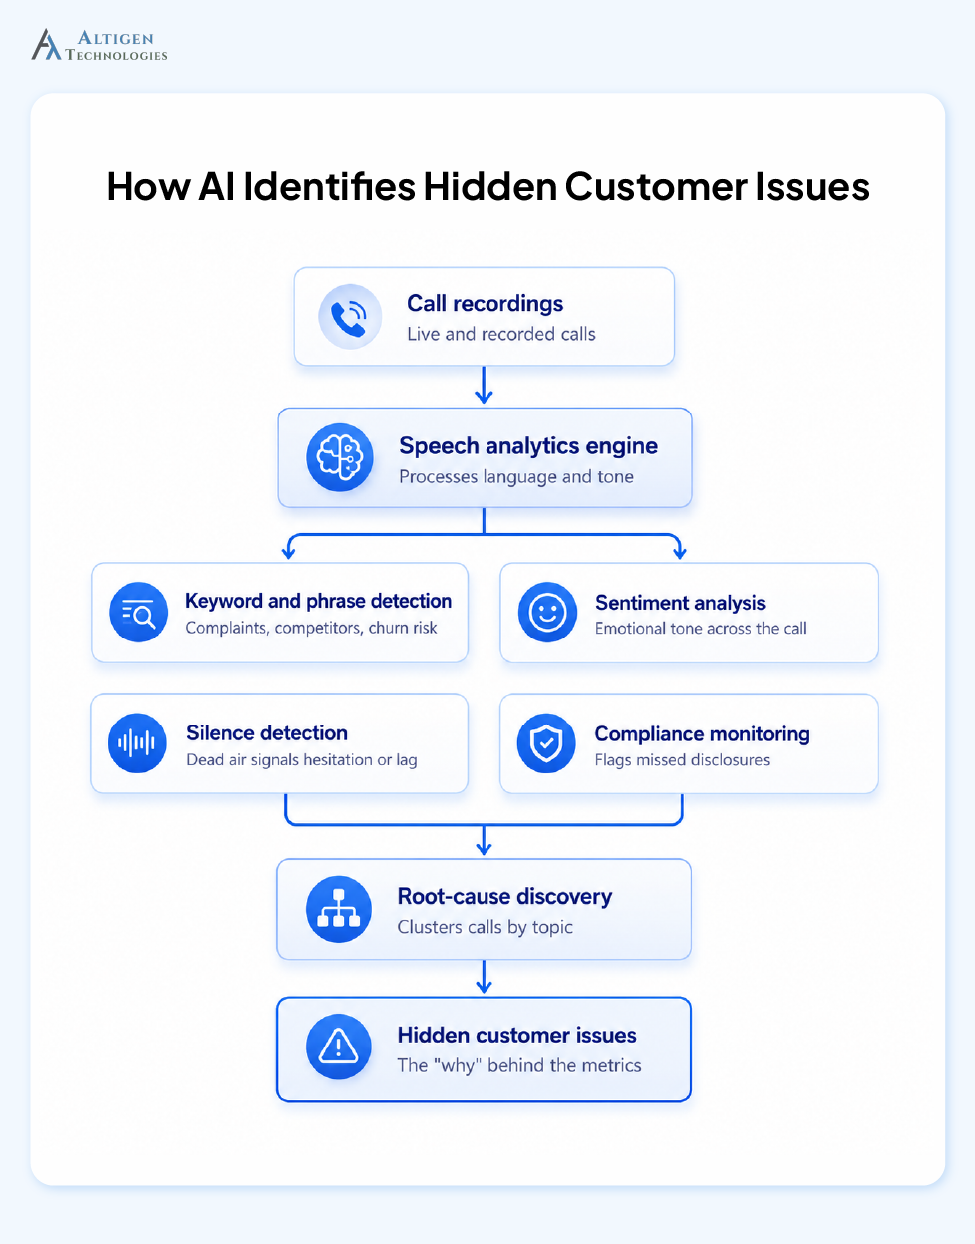
How call center software turns data into insights
AI-powered call center software transforms raw interaction data into insights by analyzing conversations, identifying customers issues, detecting operational issues, and recommending actions that improve customer experience. Instead of simply reporting metrics, it explains why those metrics changed and what you should do next.
- Speech analytics: Detect recurring complaints, sentiment, compliance risks, and emerging issues.
- Trend detection: Identify recurring patterns across queues, products, or customer segments.
- Root-cause analysis: Connect drops in CSAT or FCR to specific conversations, policies, or processes.
- Agent performance insights: Highlight coaching opportunities using real customer interactions.
- Predictive recommendations: Suggest routing, staffing, or knowledge base improvements based on historical trends.
Final takeaway
Before adding a metric to a dashboard, ask one question: Does this number predict an outcome, or does it just describe activity? FCR, CSAT, CES, and sentiment predict outcomes. Occupancy and schedule adherence describe activity.
Both are important, but the first group helps improve customer experience, agent performance, and business results. The second group helps you understand capacity and operational efficiency rather than customer satisfaction or issue reslution.
If you’re looking for call center software that simplifies analytics, try Altigen CoreEngage. This platform offers real-time dashboards, speech analytics, and actionable insights to help you make data-driven decisions and improve customer experience. Contact us today.
Frequently asked questions
Reporting shows what happened, using metrics like CSAT or abandonment rate on a dashboard. Analytics explains why it happened and what to do next, using diagnostic tools like speech analytics and trend analysis.
FCR, CES, and customer sentiment are among the strongest predictors of customer churn. A customer effort score alone can flag disloyalty risk, since high-effort interactions are strongly linked to customers leaving.
AI is changing call center analytics by automatically analyzing customer conversations, identifying patterns, predicting outcomes, and providing actionable insights instead of just reporting metrics.
First Call Resolution (FCR) is one of the most effective metrics that is directly connected to customer satisfaction (CSAT). Improving it helps reduce repeat contact rates and operational costs at the same time.
Critical metrics like service level, queue time, and abandonment rate should be monitored in real time or daily. Customer experience and agent performance metrics, such as CSAT, FCR, and QA scores, should be reviewed weekly or monthly to identify trends and improvement opportunities.
You should look for software that offers real-time dashboards, AI-powered sentiment analysis, customizable reports, performance dashboards, root-cause analysis, and CRM integrations.