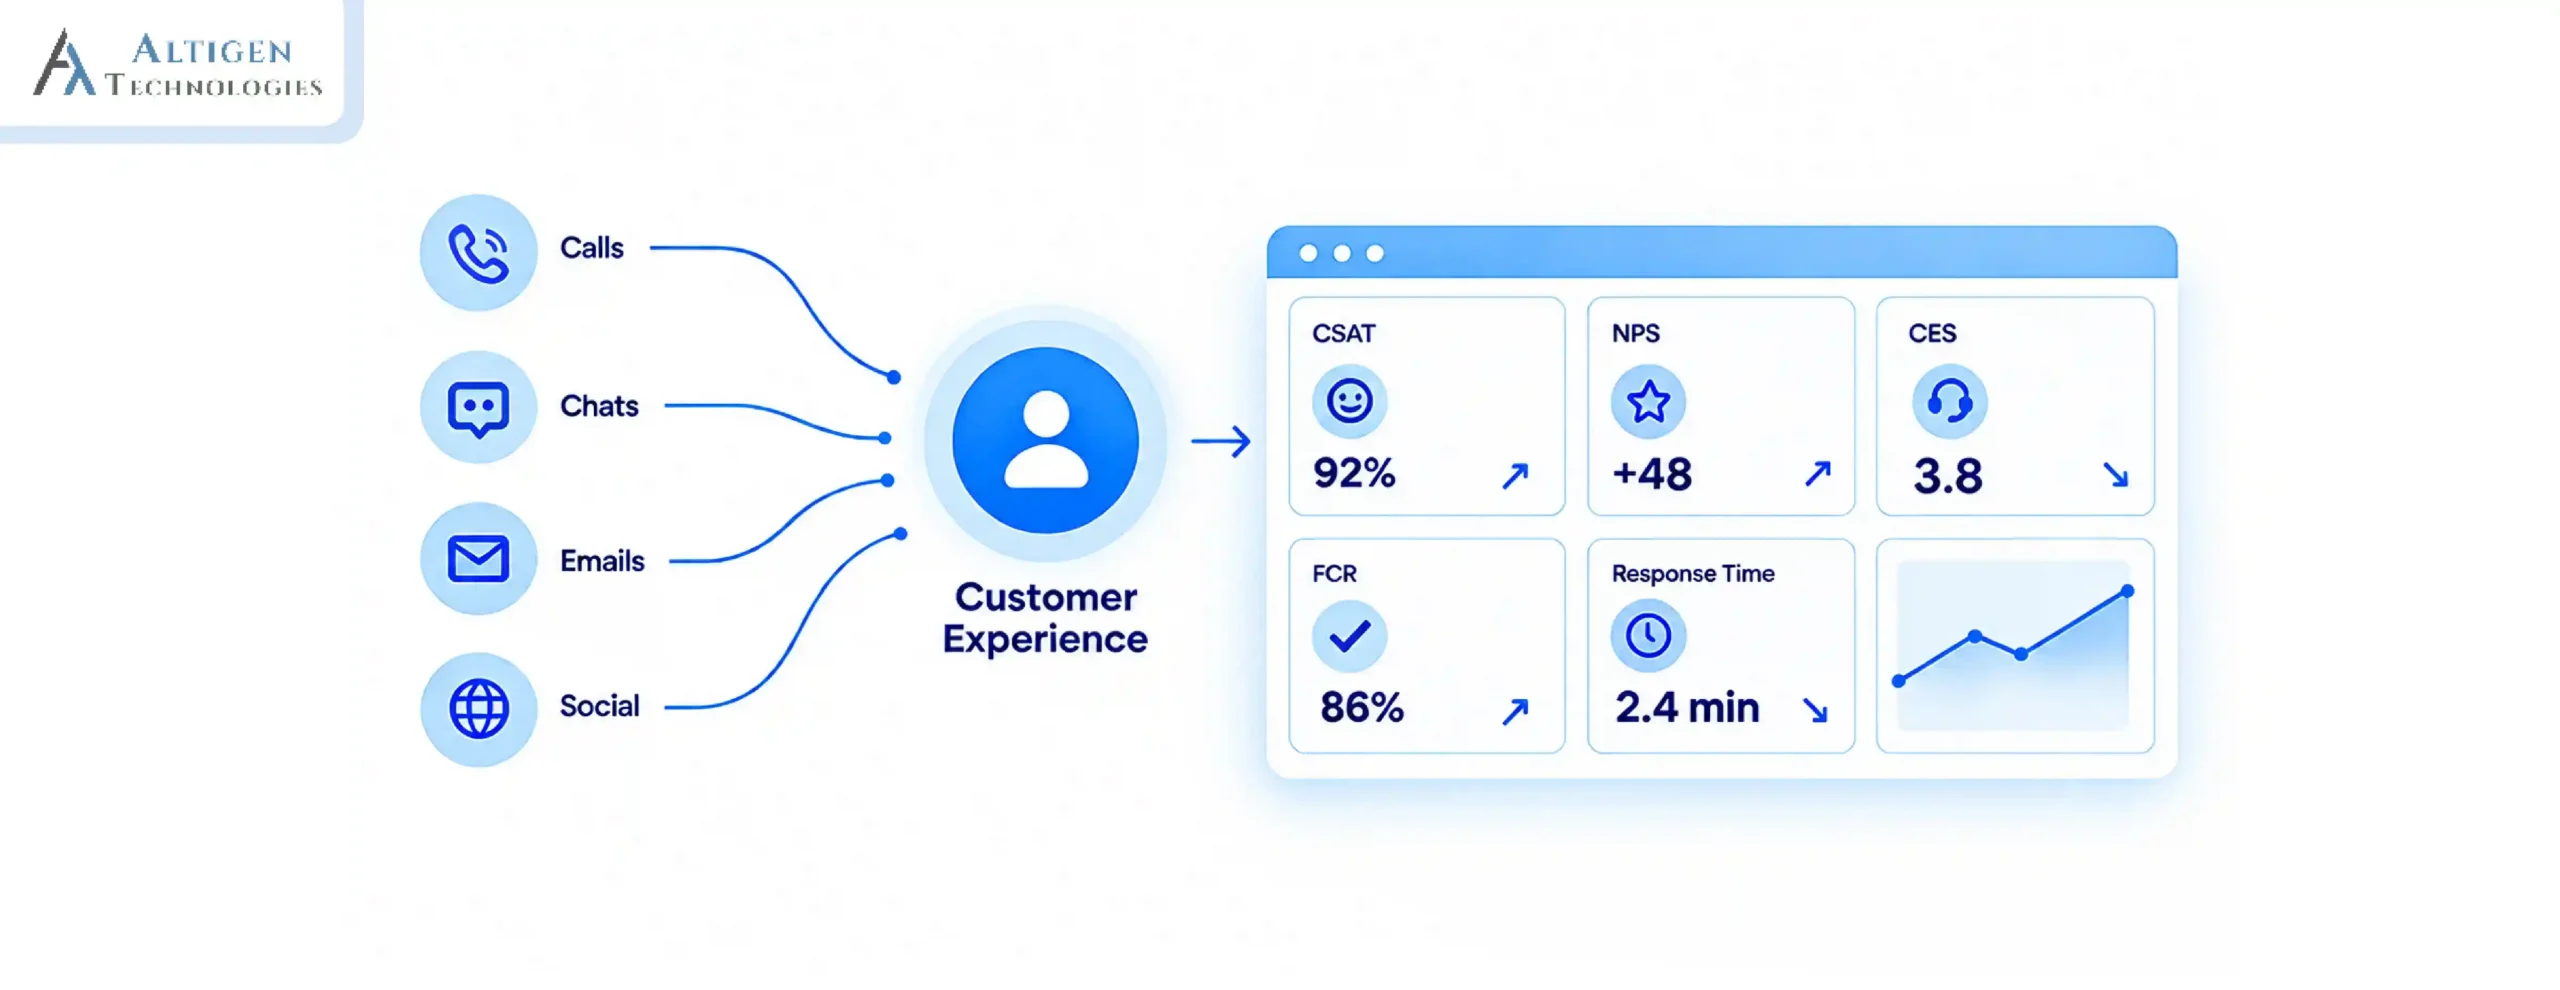
A financial institution can offer competitive rates, strong products, and convenient digital banking and still lose customers. The reason can be a poor customer experience. A difficult loan application, unresolved fraud issue, or repeated contact with the support team can impact customers’ trust quickly.
The risk is reflected in current banking research. A JD Power report found that overall U.S. retail banking satisfaction reached 655 out of 1,000 in 2025, but customers still reported problems with fees, service, and issue resolution. Among customers who reported a problem, only 59% had it resolved with one contact.
Customer experience metrics help financial institutions understand how customers perceive their services, where they face issues, how effectively financial institutions resolve them, and whether those experiences affect loyalty and long-term customer value.
This guide covers the core metrics to track, how they connect to business outcomes, and how to build a measurement approach around both.
| Quick Takeaway 1. Customer experience metrics help financial institutions identify service issues, measure customer sentiment, and understand where journeys are impacted. 2. Metrics such as CSAT, NPS, CES, FCR, retention, digital experience, and CLV provide different views of customer experience and business impact. 3. Combining customer feedback, operational data, digital behavior, and financial outcomes gives decision-makers the right data to take necessary actions. |
What are customer experience metrics?
Customer experience metrics are quantitative measures used to evaluate how customers perceive, interact with, and respond to a financial institution across different touchpoints and journeys.
These metrics can be grouped into three categories based on what they measure:
- Customer metrics: measures of customer perceptions, satisfaction, effort, and loyalty (CSAT, NPS, CES)
- Operational metrics: measures of how a process performed, which often shape the CX outcome (FCR, resolution time)
- Business outcome metrics: financial results that experience quality eventually influences (retention, CLV)
Understanding this difference helps financial institutions take appropriate action to improve specific metrics. FCR, for example, is technically operational, but it directly impacts whether a customer feels their problem was actually taken seriously.
Call center analytics can help financial institutions bring these different data points together to identify patterns in customer interactions and service performance.

6 Customer experience metrics financial institutions should track
Financial institutions should track these metrics to assess customer satisfaction, loyalty, effort, resolution quality, and digital experiences.
| Customer Experience Metrics | What It Measures |
| CSAT | Customer satisfaction |
| NPS | Customer loyalty |
| CES | Customer effort to get a solution |
| FCR | How many issues are resolved at the first contact |
| Retention Rate | Customer loyalty/continuity |
| CLV | Long-term customer value |
1. Customer Satisfaction Score (CSAT)
Customer satisfaction score (CSAT) measures how satisfied a customer was with a specific interaction, typically collected immediately after the interaction through a simple survey question like “How satisfied were you with this interaction?”
How to calculate CSAT: Divide the number of satisfied responses by the total number of responses and multiply by 100. For example, if 80 out of 100 customers rate their experience as satisfied, the CSAT score is 80%.
CSAT = (Satisfied responses ÷ Total responses) × 100
Why it is important: CSAT is useful because it captures customer sentiment close to the interaction that caused it. Financial institutions can collect CSAT after:
- Resolving a fraud dispute
- Completing a loan application
- Speaking with a contact-center agent
- Completing an account-service request
A declining CSAT score can point to problems with communication, agent support, resolution quality, or the overall service process.
2. Net Promoter Score (NPS)
NPS asks customers how likely they are to recommend the institution, then sorts responses into promoters, passives, and detractors.
NPS measures a customer’s likelihood of recommending an institution, providing an indicator of customer loyalty and relationship sentiment.
Customers answer:
“How likely are you to recommend this company to a friend or colleague?”
Responses are divided into:
- Promoters: 9-10
- Passives: 7-8
- Detractors: 0-6
How to calculate NPS:
NPS = Percentage of Promoters − Percentage of Detractors
Financial institutions can use relationship NPS to assess the broader customer relationship or transactional NPS to evaluate a particular journey.
Why it is important: NPS score gives executives a high-level view of customer loyalty. It can help identify differences between customer segments, products, or service experiences.
However, NPS does not explain the underlying cause of customer sentiment. A low score could result from poor service, fees, digital access issues, product limitations, or other factors.
That makes NPS more useful when combined with metrics such as CSAT, CES, FCR, retention, and customer feedback.
3. Customer Effort Score (CES)
Financial services contain many processes that can become complicated quickly. Customers may need to verify their identity, provide documents, navigate several screens, contact multiple teams, or repeat information.
Common financial-services examples include:
- Opening an account
- Applying for a loan
- Resetting credentials
- Disputing a transaction
- Finding information in digital banking
CES also provides information that CSAT can miss. A customer might eventually be satisfied with the result while still having to complete a frustrating process.
How to calculate CES:
CES can be measured by asking customers how easy or difficult it was to complete a specific task or resolve an issue, immediately after the interaction. A common approach is to ask a question using a 5-point scale, such as:
“How easy was it to resolve your issue today?”
Customers then rate the experience from 1 = Very difficult to 5 = Very easy.
The CES can then be calculated as:
CES = Sum of all customer effort ratings ÷ Number of responses
For example, if five customers give ratings of 4, 5, 3, 4, and 5:
CES = 21 ÷ 5 = 4.2
A higher score indicates a lower-effort experience when using an “easy-to-difficult” scale.
Why it is important: It shows how easy or difficult customers find it to complete a task or resolve an issue, which directly impacts their experience and loyalty.
4. First Contact Resolution (FCR)
FCR tracks how many customer issues get resolved in a single contact, without a callback or repeat interaction. A high FCR can indicate that customers are getting their issues resolved without being transferred or asked to contact the institution again. According to a Deloitte report, after a poor experience, 28% of customers reduced spending, and 31% stopped doing business with the bank.
How to calculate FCR: (issues resolved on first contact ÷ total issues) x 100
Why repeat contacts hurt customer experience: Every additional contact required to fix the same problem can increase customer frustration and indicate that the issue was not resolved effectively.
However, financial institutions should not improve FCR just by closing cases quickly. If an issue remains unresolved, the metric can look healthy while the customer experience deteriorates.
Why it is important: FCR helps financial institutions identify whether customers are getting their issues resolved without unnecessary transfers, callbacks, or repeat contacts.

5. Customer retention rate
Customer retention metrics measures the percentage of customers retained by a financial institution. In banking and financial services, retention can reflect whether customers continue maintaining accounts, using products, and relying on the institution for key financial needs.
How to calculate Retention Rate:
Retention Rate = [(Customers at end of period − New customers acquired) ÷ Customers at start of period] × 100
Why it is important: Retaining existing customers helps financial institutions reduce customer churn, maintain recurring revenue, increase product adoption, and generate more value from existing customer relationships.
6. Customer lifetime value (CLV)
CLV gives executives the financial perspective that most CX metric lists leave out. It measures the total revenue generated from a customer as long as they remain with the institution.
Why it is important: It helps financial institutions understand how much a customer is worth over time and how much they can invest in retaining them.
CLV is a result of consistent, good experiences, not a direct measure of experience quality. It shows the size of the stakes, not where the problem is.
How to calculate CLV: A simple approach is to multiply the average customer value by the average customer lifespan.
CLV = Average revenue per customer × Average customer lifespan
For example, if a customer generates an average of $1,000 per year and remains with the institution for five years, the estimated CLV is $5,000.
Why are customer experience metrics important for financial institutions?
Tracking customer satisfaction metrics helps financial institutions identify problems with their service early and make improvements on time.
1. Identify problems in customer journeys
Financial institutions can use CX metrics to identify problems across journeys such as:
- Opening a bank account
- Applying for a loan
- Making payments or transfers
- Reporting fraud
- Disputing a transaction
- Contacting customer support
- Completing tasks through digital banking
For example, a declining Customer Effort Score during loan applications could indicate confusing documentation requirements, repeated data entry, unclear instructions, or poor communication about application status.
2. Detect problems before they affect retention
Retention and churn show the outcome of customer behavior. Customer experience metrics can provide earlier warning signs.
For instance, a decline in CSAT after customer-service interactions may indicate a service problem before it becomes visible in customer attrition data.
3. Prioritize investments in customer experience
Financial institutions have limited resources and cannot fix every customer journey simultaneously. CX metrics can help executives determine which problems deserve attention first.
For example:
- High digital adoption + high task abandonment could indicate a usability problem.
- Low FCR + high repeat contacts could indicate a service-resolution problem.
- High NPS + declining retention could indicate that overall sentiment does not reflect a problem with a particular product or segment.
4. Connect customer experience to business outcomes
A strong CX measurement program should go beyond asking whether customers are satisfied.
Decision-makers should also ask:
- Are customers staying longer?
- Are they using more products?
- Are they moving activity to digital channels?
- Are they contacting support repeatedly?
- Are high-value customers experiencing more problems?
- Is poor service associated with customer churn?
This connection makes CX metrics more useful for business planning and investment decisions.
Common mistakes to avoid when measuring customer experience
- Using NPS as the only CX metric: it signals general sentiment but explains nothing about where the problem actually lives.
- Tracking too many metrics: a scorecard with 20 KPIs gets ignored; a focused set gets used.
- Measuring satisfaction without effort: A customer can rate an interaction well while the underlying process remains genuinely difficult.
- Optimizing handle time instead of customer outcomes: Closing calls fast is of no use if you are not solving the problem.
- Ignoring digital and self-service journeys: A growing share of banking interactions never touch a human agent, and those journeys need their own measurement.
- Looking at averages without segmentation: A strong overall CSAT can hide an underserved customer segment.
- Measuring metrics without taking action: Collecting only data does not help if you don’t take action to improve customer experience.
- Not connecting CX metrics to financial outcomes: Without linking how poor customer experience impacts business outcomes, it is difficult to understand their financial impact or justify where improvements are needed.
How contact center software help businesses track customer experience metrics
Contact centers generate valuable CX data across customer interactions. The challenge is turning that information into useful insight without requiring teams to review every interaction manually.
Altigen’s CoreEngage is contact center software for Microsoft Teams that provides omnichannel customer engagement, advanced reporting, AI-powered conversation intelligence, sentiment analysis, and CRM integration.
For financial institutions, CoreEngage can help teams monitor customer interactions and identify patterns related to:
- First contact resolution
- Customer sentiment
- Agent performance
- Call and interaction trends
- Average handle time
- Service quality
- Customer feedback
- Contact-center KPIs
Its sentiment analysis can identify customer sentiment during interactions and help teams identify satisfaction trends and areas that may require service improvement. CoreEngage also provides real-time and historical reporting, performance tracking, and customer feedback collection.
Suggested Reading: How to Choose the Right Contact Center Software for Financial Institutions
Final takeaway
Customer experience metrics help financial institutions understand where customers face problems, how effectively service issues are resolved, and whether those experiences affect loyalty and customer value. CSAT, NPS, CES, FCR, resolution time, retention, digital experience, and CLV each provide a different perspective.
By combining metrics around customer feedback, operational data, behavioral signals, and financial outcomes, financial institutions can identify important problems and make better decisions about where to improve the customer journey. Contact center software like
Altigen’s CoreEngage helps financial institutions track these key metrics and identify trends, monitor performance, and improve customer experiences over time. Schedule a demo today.

Frequently asked questions
One single metric does not cover everything for a financial institution. A balanced set of metrics usually includes CSAT, NPS, CES, FCR, retention, and CLV. Each metric covers a different part of the perception, service performance, and financial impact picture.
NPS measures overall customer loyalty and the likelihood that they would recommend the institution’s services to others. CSAT measures customer satisfaction with a specific interaction. CES measures how much effort a customer had to put to get a problem resolved. Each captures a different dimension of experience.
Banks and credit unions should track a mix of CX metrics across three categories including customer perception metrics (NPS, CSAT, CES), service metrics (FCR, resolution time), behavior metrics (retention, digital adoption), and business impact (CLV), weighted according to current priorities.
Transactional metrics like CSAT and CES should be captured immediately after relevant interactions. Relationship-level metrics like NPS and retention should be reviewed quarterly, while FCR and resolution time should be monitored continuously.
The benchmarks vary by institution type and channel, but a rising trend is more important than a single absolute number. Comparing scores against the institution’s own historical performance, segmented by journey, gives a more accurate picture than only following an industry-wide target.
By tracking business outcome metrics like retention and CLV alongside experience metrics like CES and FCR, financial institutions can identify which specific problems correlate with account closures or reduced product adoption, then prioritize the problems with the greatest business impact.
Yes, these metrics indirectly measure customer experience. These are operational in nature, but they influence how a customer perceives the institution’s reliability and responsiveness.