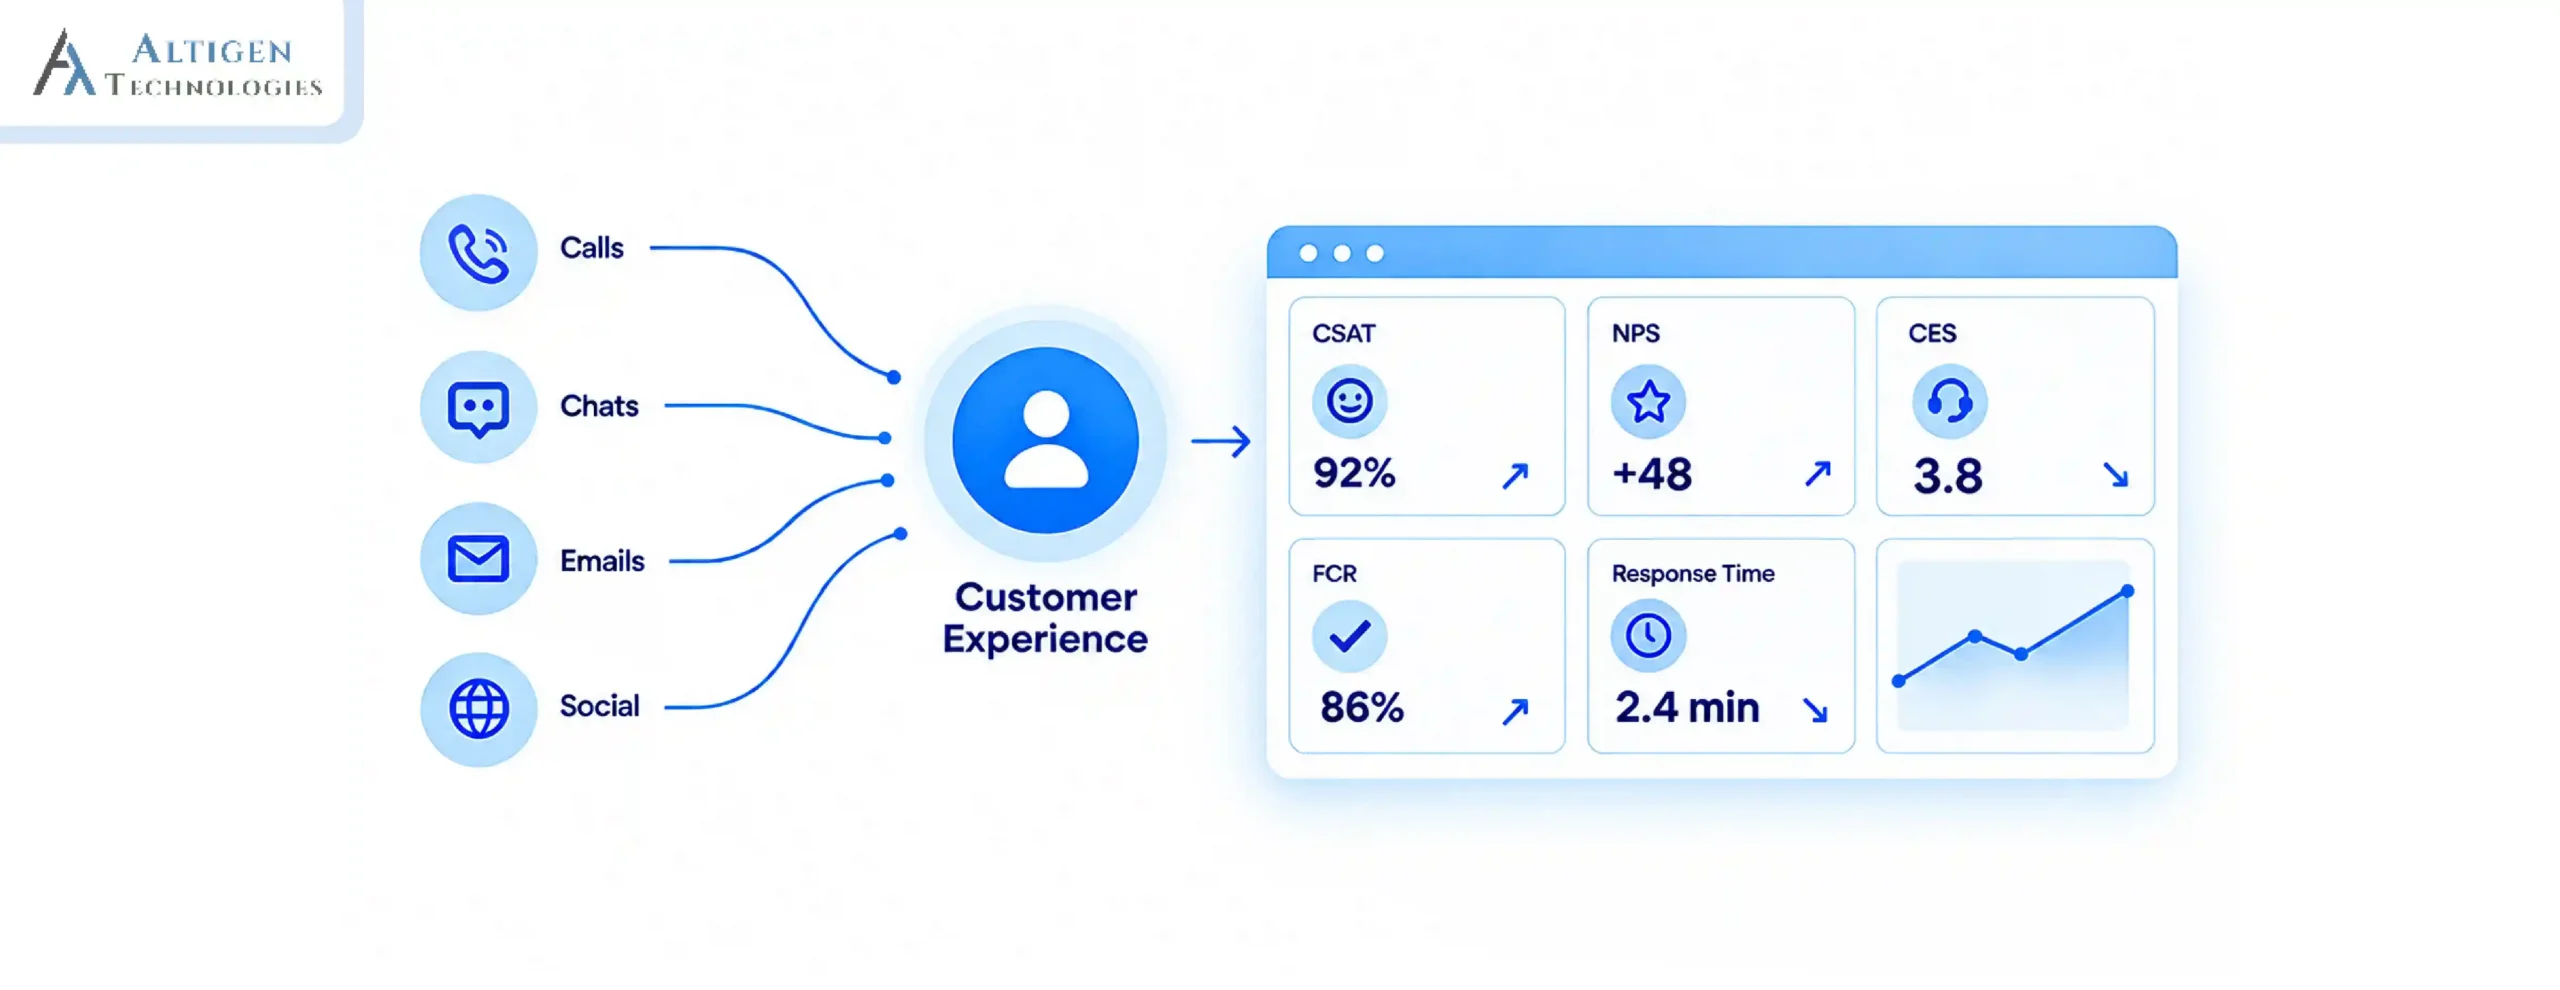
A customer waits on hold, gets transferred twice, and finally reaches an agent who resolves the issue. But the damage was already done. The customer expressed dissatisfaction in the post-call survey.
According to SQM Group, when a call gets transferred, customer satisfaction drops by 12% and First Call Resolution drops by 14% compared to calls that don’t. That’s the real cost of treating CSAT as a lagging metric instead of an operational signal.
A customer satisfaction score (CSAT) tells you whether the customers are satisfied or dissatisfied after the conversation, helps identify the reasons behind their feeling. This guide covers what is CSAT, how to calculate it, and the concrete steps to improve CSAT.
| TL;DR – 30 Seconds Quick Takeaways CSAT measures customer satisfaction after individual interactions, helping contact centers identify service issues and improve customer experience. CSAT score should be analyzed alongside metrics such as FCR, CES, AHT, and customer sentiment to uncover the root causes of customer satisfaction or dissatisfaction. Lower transfer rates, shorter wait times, fewer repeat contacts, and effective agent coaching all contribute to higher customer satisfaction. AI-powered analytics help contact centers improve CSAT by identifying customer sentiment, automating repetitive tasks, and providing key insights for continuous improvement. |
What is customer satisfaction score (CSAT) and why is it important
Customer satisfaction score (CSAT) is a customer experience metric that measures how satisfied customers are with a specific interaction, product, or service. Contact centers use it after support calls, live chats, and email conversations to understand whether customer expectations were met.
The score comes directly from a customer satisfaction survey, in which customers rate their experience on a predefined scale, usually 1 to 5 or 1 to 10.
A CSAT survey asks a simple question such as:
“How satisfied were you with the support you received today?”
Customers then choose a rating that reflects their experience. It provides insight into whether operational improvements are actually improving customer experiences.
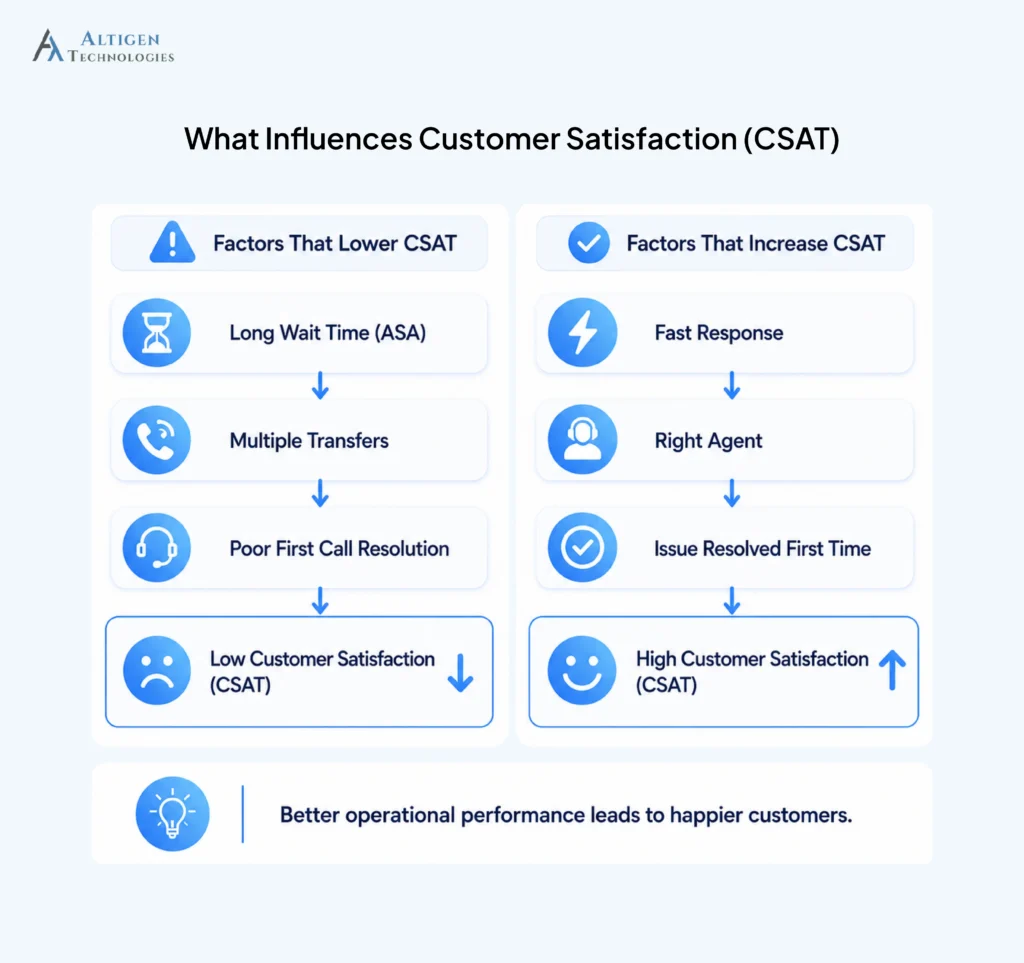
For example, a low CSAT score may indicate problems such as:
- Long average speed of answer (ASA)
- High queue time
- Multiple call transfers
- Poor first call resolution (FCR)
- High repeat contact rate
- Low agent knowledge
- Poor communication during interactions
On the other hand, high CSAT scores reflect efficient operations, knowledgeable agents, and smooth customer journeys.
Why customer satisfaction (CSAT) score is important in contact centers
Every CSAT survey result shows how customers perceive your brand. While operational metrics such as Average Handle Time (AHT), occupancy, schedule adherence, and after-call work help managers measure efficiency, they don’t explain whether customers actually left satisfied.
CSAT addresses that.
It helps contact centers:
- Measure customer satisfaction after every interaction
- Identify trends across agents, queues, or channels
- Evaluate whether coaching improves service quality
- Compare customer experience across phone, chat, email, and messaging in omnichannel contact center
- Detect recurring issues before they affect customer loyalty
Suggested Reading: How to Deploy Omnichannel Contact Center on Teams
How to calculate customer satisfaction score
Calculating a CSAT score is easy.
The standard formula is:
CSAT (%) = (Number of satisfied responses ÷ Total survey responses) × 100
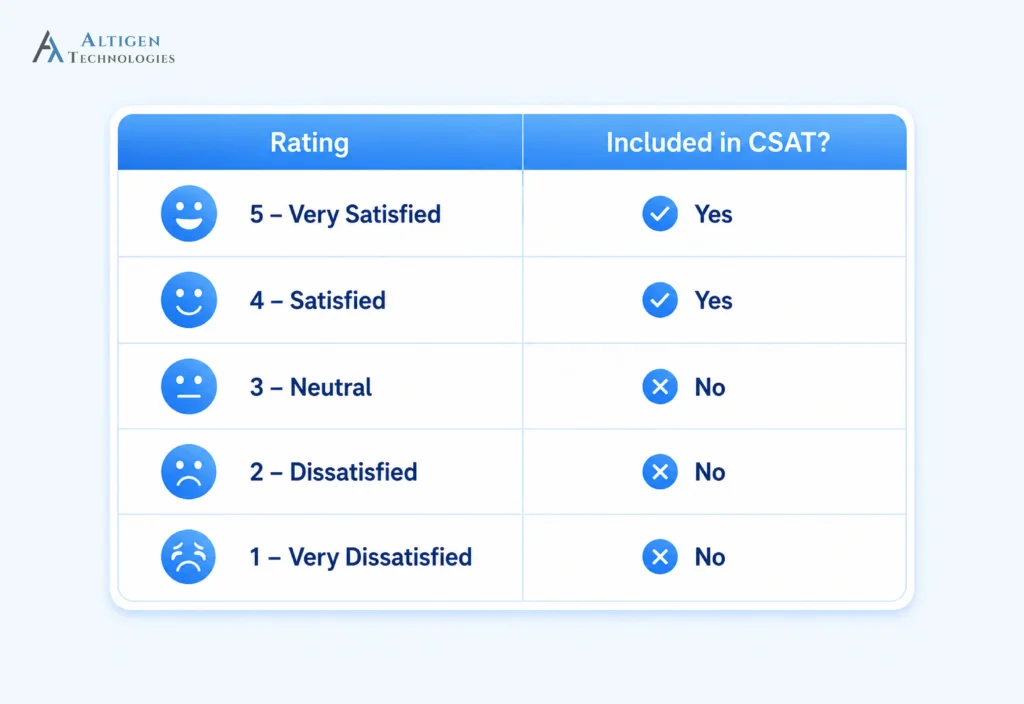
Most organizations consider customers selecting the top two ratings as satisfied. For a 5-point survey, this means:
Example of calculating CSAT
CSAT (%) = (Satisfied Responses ÷ Total Responses) × 100
Suppose a contact center received 1000 customer satisfaction survey responses in a week.
| Rating | Responses |
| Very Satisfied (5) | 524 |
| Satisfied (4) | 216 |
| Neutral (3) | 120 |
| Dissatisfied (2) | 42 |
| Very Dissatisfied (1) | 98 |
Total responses: 1000
Satisfied responses = 524 + 216 = 740
Now apply the formula:
CSAT = (740 ÷ 1000) × 100
CSAT = 74%
This means 74% of customers were satisfied with their support experience.
Which Responses Count as “Satisfied”?
The answer depends on the rating scale an organization uses, which varies depending on industry and individual company. Always define your methodology before comparing CSAT across teams or reporting periods. Here are the standard sales most organizaions use.
| Survey Scale | Satisfied Responses |
| 5-point scale | 4 and 5 |
| 10-point scale | Usually 8–10 (organization dependent) |
| Emoji scale | Happy and Very Happy |
Best practices for measuring CSAT
A customer satisfaction score is useful if the survey results accurately reflect customer experiences.
To improve reliability:
- Send surveys immediately after the interaction.
- Keep surveys short, ideally one or two questions.
- Measure every customer channel using the same scoring methodology.
- Track CSAT by agent, team, queue, and communication channel.
- Review written comments alongside numerical ratings.
- Monitor trends instead of focusing on a single week’s score.
It’s also helpful to compare CSAT with related customer feedback metrics such as:
- Net Promoter Score (NPS)
- Customer Effort Score (CES)
- Customer sentiment
- QA scores
- First Call Resolution (FCR)
- Repeat contact rate
- Escalation rate
These metrics provide a more complete understanding of customer experience than any single KPI alone.
What is a good customer satisfaction score
A good customer satisfaction score (CSAT) depends on your industry, the complexity of customer issues, and the channels you support. For example, a technical support team handling complex enterprise cases may naturally receive slightly lower scores than a retail contact center answering simple order-related queries.
Instead of comparing your CSAT with companies in completely different industries, benchmark your performance against businesses with similar customer expectations and support models.
As a general guideline:
| CSAT Score | Performance |
| 90% and above | Excellent |
| 80% to 89% | Good |
| 70% to 79% | Average |
| Below 70% | Needs improvement |
Industry CSAT benchmarks
The American Customer Satisfaction Index (ACSI) publishes annual customer satisfaction benchmarks across industries in the United States. While ACSI measures broader customer satisfaction rather than post-interaction CSAT surveys, it provides a useful reference point for understanding customer expectations.
| Industry | Average Satisfaction Score |
| Software & Information | 78 |
| Internet Retail | 80 |
| Banks | 80 |
| Hospitals | 74 |
| Health Insurance | 73 |
| Airlines | 77 |
| Telecommunications | 74 |
These benchmarks are reference values rather than strict targets. A more useful approach is to monitor whether your own CSAT is improving over time.
For example, increasing your CSAT from 74% to 80% over two quarters reflects operational improvement.
CSAT vs. NPS vs. CES
CSAT is one of the most widely used customer feedback metrics, but it doesn’t answer every question about customer experience. That’s why many organizations measure Customer Satisfaction Score (CSAT) alongside Net Promoter Score (NPS) and Customer Effort Score (CES).
Each metric focuses on a different stage of the customer relationship.
| Metric | Measures | Best Used For |
| CSAT | Satisfaction after a specific interaction | Support calls, chats, tickets, onboarding |
| NPS | Customer loyalty and willingness to recommend | Overall brand relationship |
| CES | How easy it was for customers to get help | Service and support processes |
CSAT shows whether customers were satisfied with a specific interaction. NPS indicates how likely customers are to recommend your company, reflecting long-term loyalty. CES measures how easy it was for customers to resolve their issue.
Rather than choosing one metric, high-performing contact centers use all three together.
- CSAT measures whether customers were satisfied.
- CES explains how easy it was to get support.
- NPS indicates whether satisfied customers are likely to remain loyal.
How to improve customer satisfaction score: 8 proven strategies
Improving customer satisfaction isn’t about asking customers to complete more surveys. It starts with identifying the sources of customer frustration and removing them.
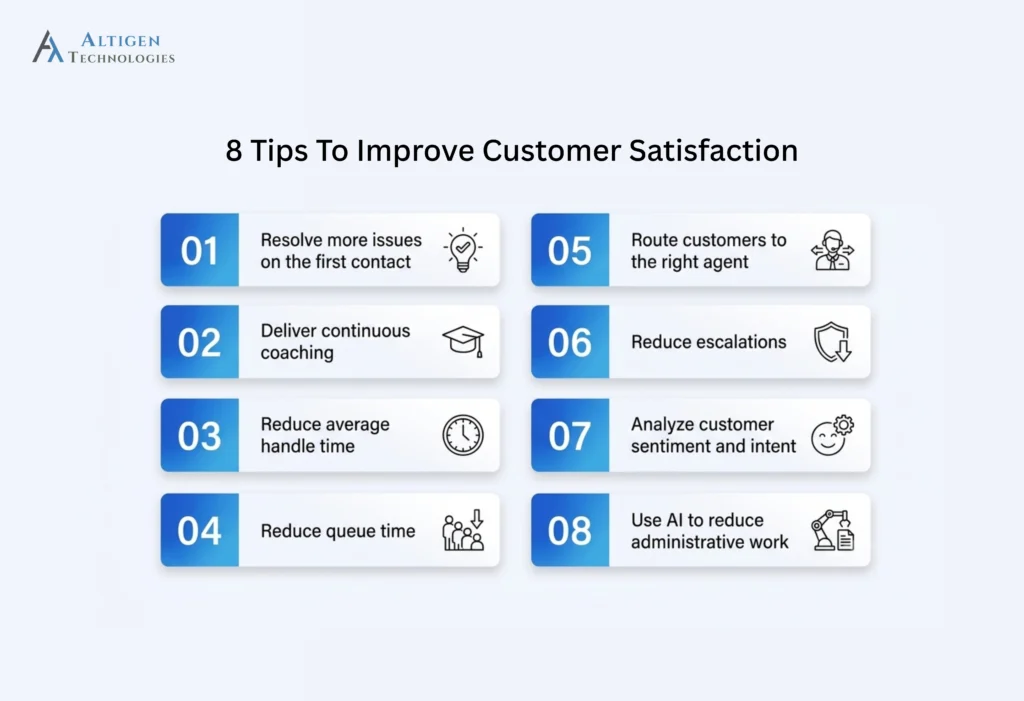
The most successful contact centers improve CSAT by focusing on three areas:
- Improve agent performance
- Optimize contact center operations
- Use AI and call center analytics to continuously improve service
Improve agent performance
1. Resolve more issues on the first contact
Nothing frustrates customers more than contacting support multiple times for the same problem. Improving First Call Resolution (FCR) has a direct impact on customer satisfaction because customers value quick and complete resolutions.
To improve FCR:
- Provide agents with updated knowledge bases.
- Give agents access to customer history.
- Reduce unnecessary call transfers.
- Use skill-based routing to connect customers with the right specialist the first time.
2. Deliver continuous coaching
Customer expectations change quickly, and agent coaching should keep pace.
Reviewing QA scores, customer comments, and call recordings regularly helps supervisors identify coaching opportunities before small issues become recurring problems.
Focus coaching on:
- Active listening
- Empathy
- Product knowledge
- Clear communication
- Problem-solving
- Compliance
Real-time feedback also helps improve consistency across teams.
3. Reduce average handle time
Lower average handle time (AHT) improves efficiency, but shorter calls don’t always lead to happier customers.
Instead of encouraging agents to end calls quickly, help them:
- Access customer information faster.
- Reduce repetitive manual work.
- Use AI-generated conversation summaries.
- Eliminate unnecessary after-call work.
The goal is to remove wasted effort rather than shorten meaningful conversations.
Optimize contact center operations
Even highly skilled agents struggle to deliver great customer experiences if the contact center itself isn’t operating efficiently. Long wait times, poor routing, and staffing gaps quickly reduce customer satisfaction, regardless of how well agents handle conversations.
4. Reduce queue time
Customers expect timely support. Waiting several minutes before speaking with an agent creates frustration before the conversation even begins.
Track metrics such as:
- Average Speed of Answer (ASA)
- Queue time
- Abandonment rate
- Service level
To reduce wait times:
- Forecast demand using historical interaction data.
- Schedule agents based on peak contact volumes.
- Offer callback options during busy periods.
- Use self-service for simple requests.
According to HubSpot’s State of Customer Service Report, 90% of customers rate an immediate response as important or very important when they have a customer service question.
5. Route customers to the right agent
Every unnecessary transfer increases customer effort.
When customers repeat the same issue to multiple agents, satisfaction declines and handling times increase.
Skill-based routing improves the customer experience by matching inquiries with agents who have the right expertise.
For example:
- Billing questions go directly to finance specialists.
- Technical issues reach product support.
- VIP customers are prioritized for experienced agents.
Reducing the transfer rate also improves First Call Resolution, which has a positive impact on CSAT.
6. Reduce escalations
Frequent escalations slow resolution times and create inconsistent customer experiences.
Many escalations occur because frontline agents lack easy access to:
- Product documentation
- Troubleshooting guides
- Policy updates
- Previous customer interactions
Maintaining a centralized knowledge base and regularly updating training materials enables agents to resolve more issues independently, reducing both escalations and customer effort.
Use AI and Analytics
AI gives contact centers greater visibility into customer interactions, helping managers identify improvement opportunities much faster than manual reviews.
Rather than replacing agents, AI supports them by reducing repetitive work and surfacing insights that improve service quality.
7. Analyze customer sentiment and intent
Traditional CSAT surveys capture feedback only from customers who choose to respond.
AI-powered customer sentiment analysis evaluates every interaction by analyzing language, tone, and conversation patterns.
This helps managers identify:
- Frustrated customers
- At-risk accounts
- Recurring service issues
- Coaching opportunities
Combining sentiment analysis with CSAT provides a more complete understanding of customer experience.
8. Use AI to reduce administrative work
Agents often spend several minutes completing after-call work after every interaction.
AI can automate tasks such as:
- Conversation summaries
- Case notes
- CRM updates
- Suggested follow-up actions
- Knowledge article recommendations
Reducing administrative work allows agents to spend more time helping customers while improving agent utilization.
How to design a customer satisfaction survey
A well-designed customer satisfaction survey captures the right feedback without creating additional effort for customers.
Long surveys lead to low response rates and unreliable data. The most effective surveys are short, relevant, and sent immediately after the interaction. Here are 4 steps to design an effective customer satisfaction survey.
1. Keep Surveys Short
Ask only one primary satisfaction question.
For example: How satisfied were you with the support you received today?
Use a consistent rating scale across all channels to make reporting easier. After the rating question, include one optional follow-up question such as:
What could we have done better?
Open-ended comments reveal issues that numerical scores cannot.
2. Send surveys at the right time
Customer feedback becomes less accurate as more time passes.
Send surveys:
- Immediately after phone calls
- At the end of live chat sessions
- Within a few minutes of email resolution
- After support tickets are closed
Timely surveys capture more accurate responses because the interaction is still fresh in the customer’s memory.
3. Measure every support channel
Customers interact with businesses through multiple channels.
Measure CSAT consistently across:
- Phone
- Live chat
- SMS
- Self-service portals
Comparing channel performance helps identify where customer experience differs.
4. Segment survey results
Looking only at an overall CSAT score can hide important trends.
Break results down by:
- Agent
- Team
- Queue
- Product
- Customer type
- Region
- Support channel
This makes coaching and operational improvements much more targeted.
Customer Satisfaction Survey Templates
Below are sample customer satisfaction survey questions that work across different communication channels.
| Support Channel | Primary Question | Response Format |
| Phone Call | How satisfied were you with the support you received today? | 5-point satisfaction scale (Very Dissatisfied to Very Satisfied) |
| Live Chat | Did the agent resolve your issue during this chat? | ⭐⭐⭐⭐⭐ (1-5 rating) |
| Email Support | How satisfied are you with the resolution provided? | Very Satisfied, Satisfied, Neutral, Dissatisfied, Very Dissatisfied |
| SMS | Rate today’s support from 1 to 5, where 5 means very satisfied. | 1-5 rating |
Best practices for customer satisfaction surveys
To improve survey quality:
- Use simple, conversational language.
- Keep surveys under two minutes.
- Ask only relevant questions.
- Avoid leading or biased wording.
- Make comment fields optional.
- Review customer comments alongside CSAT scores.
- Track trends over time instead of focusing on individual responses.
Final takeaway
A customer satisfaction score shows how customers experience your support and highlights where your contact center can improve. Measuring CSAT and comparing it with metrics such as First Call Resolution, Customer Effort Score, Average Handle Time, and customer sentiment helps teams identify service gaps and address them. Continuous improvement leads to better customer experiences.
Altigen provides cloud-based contact center solutions that help businesses monitor CSAT, track customer feedback metrics, analyze customer sentiment, and improve agent performance through AI-powered quality management, and real-time analytics.
Contact us to explore our call center solutions that allows you to track every contact center metrics including customer experience and operational efficiencies.
Frequently asked questions
A good customer satisfaction score generally falls between 80% and 89%, while scores above 90% are considered excellent. However, the ideal benchmark depends on your industry, customer expectations, and support channels.
The CSAT score is calculated using the following formula:
CSAT (%) = (Number of satisfied responses ÷ Total survey responses) × 100
On a five-point survey, satisfied responses usually include ratings of 4 (Satisfied) and 5 (Very Satisfied).
The best practice is to send a customer satisfaction survey immediately after a customer interaction, whether it’s a phone call, live chat, email, or support ticket. Immediate surveys generally produce more accurate feedback and higher response rates.
Several operational factors influence customer satisfaction, including:
1. First Call Resolution (FCR)
2. Queue time
3. Average Speed of Answer (ASA)
4. Customer effort to resolve the issue
5. Communication quality
Monitoring these metrics alongside CSAT provides a clearer understanding of customer experience.
Yes, AI helps improve customer satisfaction by analyzing customer sentiment, routing interactions to the right agents, automating after-call work, identifying coaching opportunities, and providing real-time insights that improve service quality.
Customers prefer resolving their issues during the first interaction. Higher First Call Resolution (FCR) reduces repeat contacts, lowers customer effort, resulting in higher CSAT.
Along with CSAT, businesses should also track metrics such as:
1. Net Promoter Score (NPS)
2. Customer Effort Score (CES)
3. Customer sentiment
4. First Call Resolution (FCR)
5. Repeat contact rate
6. Average Handle Time (AHT)
7. QA scores
8. Transfer rate