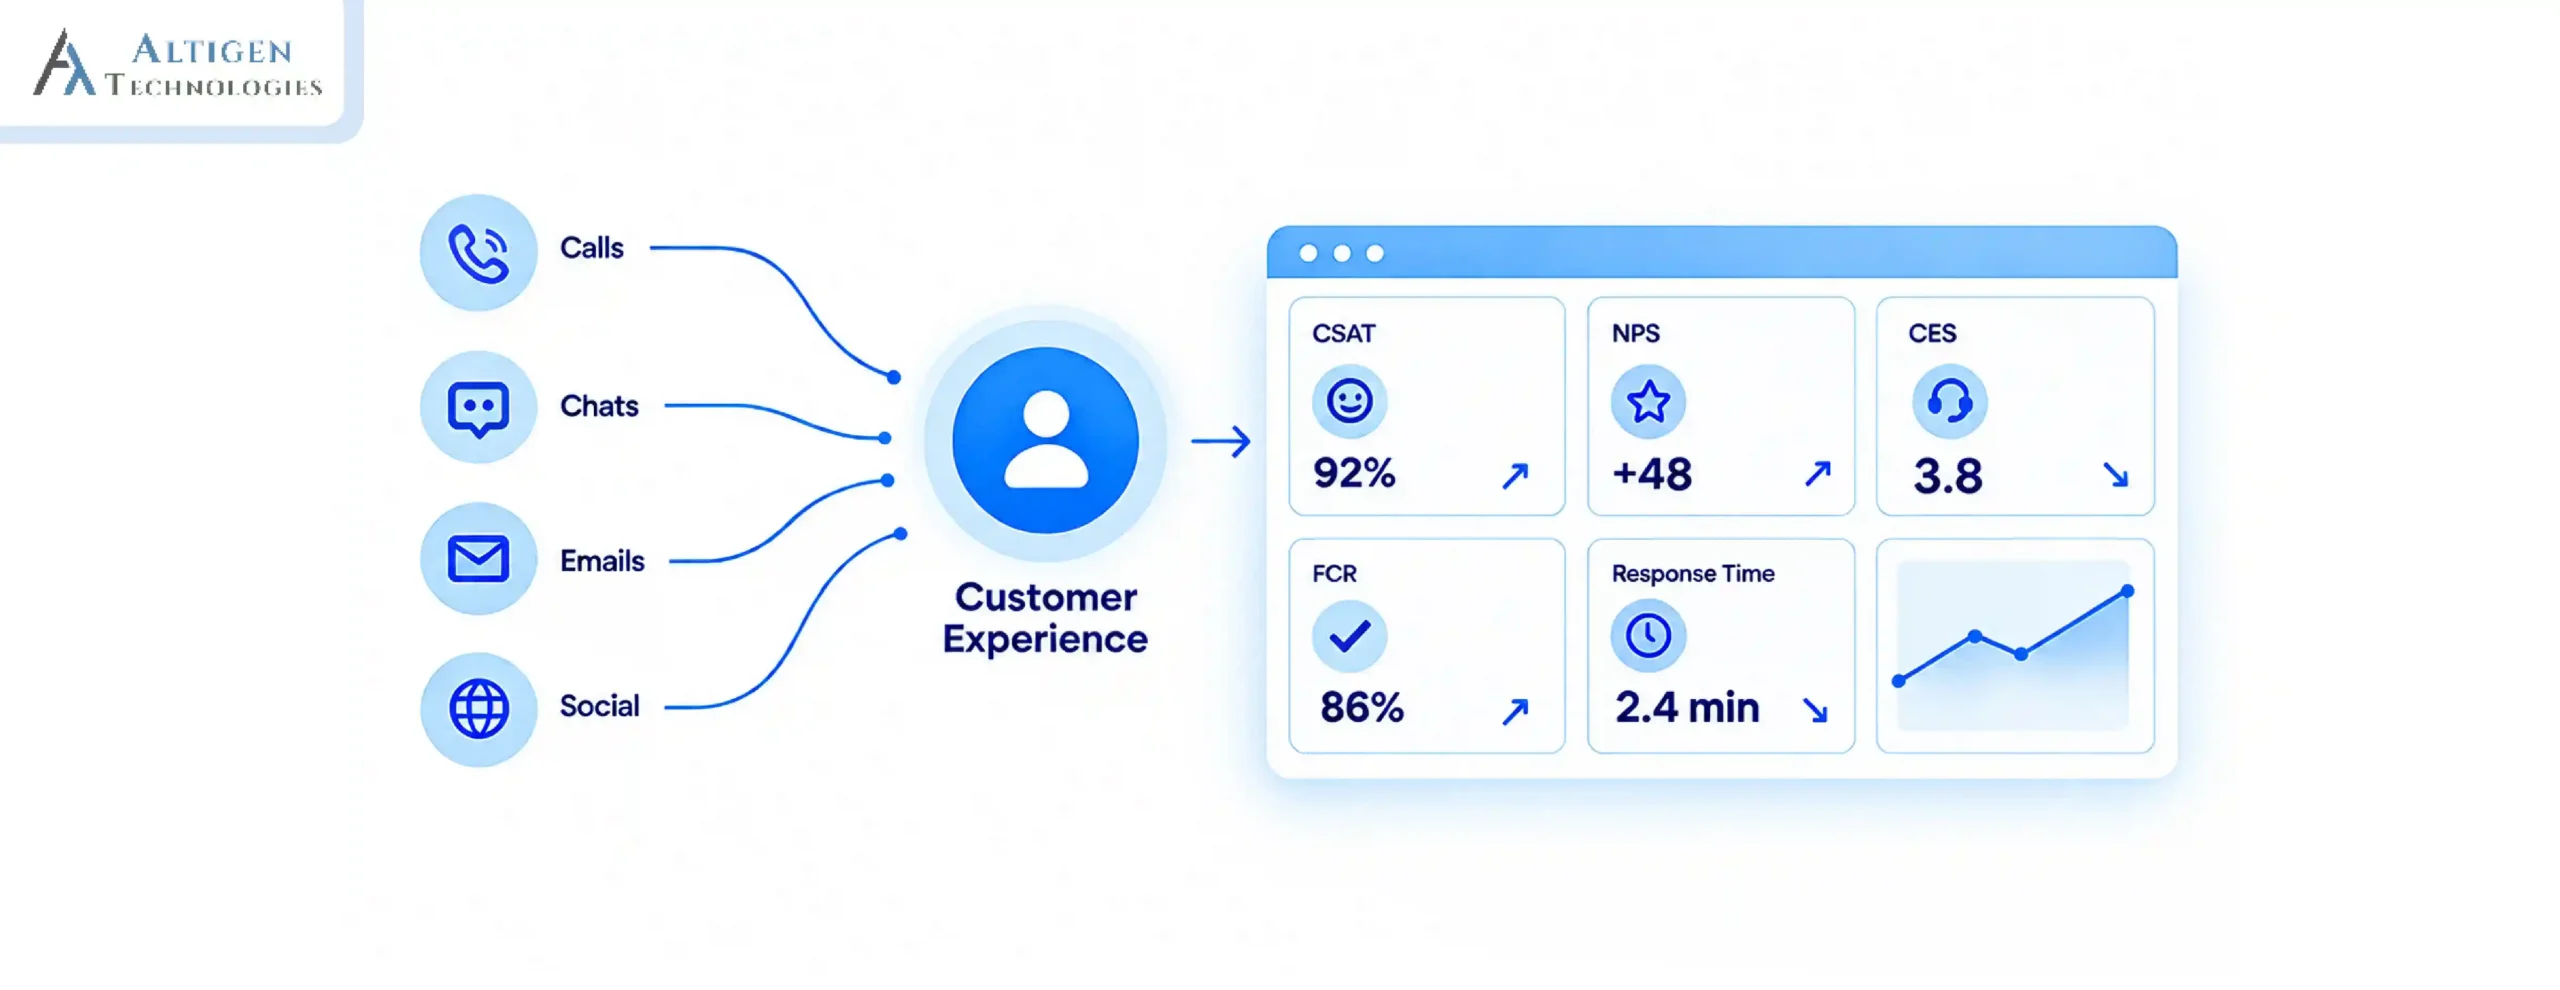
Every week, call center operations managers review dashboards filled with dozens of KPIs. Yet many still struggle to answer a simple question: Which metrics actually explain why service levels are slipping or customer satisfaction is falling? Tracking the right numbers is critical for better customer experience and operational efficiency.
According to SQM Group, the average First Call Resolution (FCR) rate across contact centers is 71%, meaning nearly three out of every ten customers need to contact a company again to resolve the same issue.
This guide covers the 10 call center performance metrics every operations manager should track to improve operational efficiency, agent performance, and customer experience.
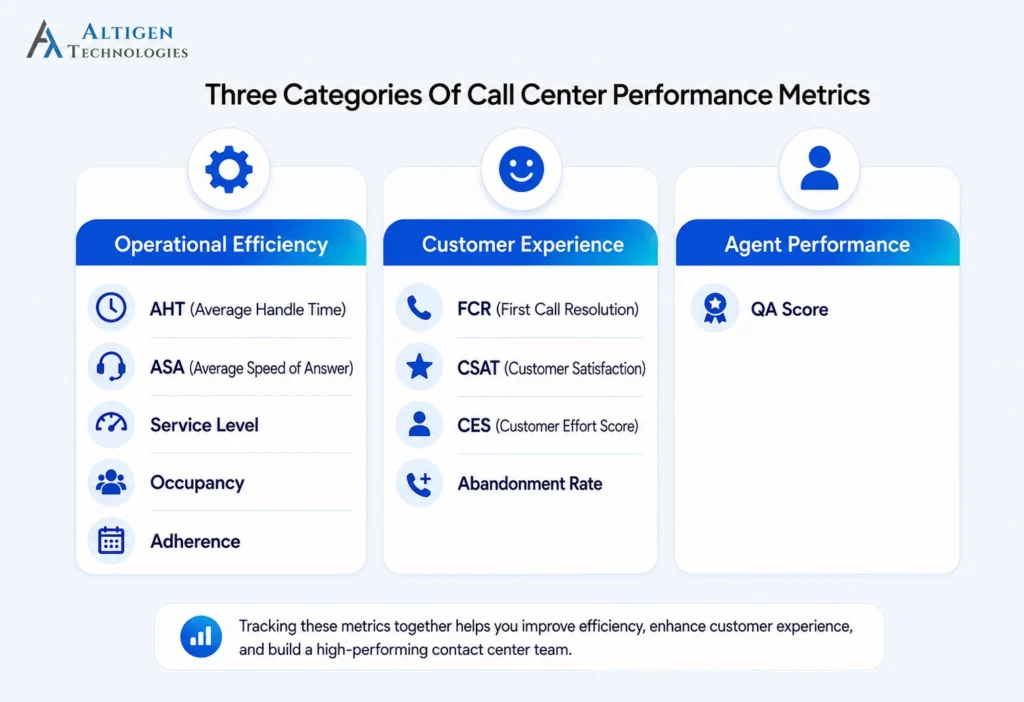
| TL;DR – Quick Takeaway 1. Track the right mix of KPIs for operational efficiency (AHT, ASA, Service Level, Occupancy, Adherence), customer experience (FCR, CSAT, CES, abandonment rate), and agent performance (QA Score) to get a complete view of contact center performance. 2. Track KPIs together to reveal the root cause of performance issues. For example, high AHT can increase queue time and lower CSAT, while higher FCR reduces repeat calls and operating costs. 3. Improve FCR, optimize staffing, strengthen QA programs, and use AI-powered monitoring to enhance agent performance and customer experience. |
Why call center performance metrics are important
Call center performance metrics help organizations track agent performance and operational efficiency and make informed decisions to improve customer service operations. When you track them consistently, they improve:
- Workforce planning: Match staffing levels to real call volume patterns instead of guesswork
- Customer satisfaction: Identify friction points before they turn into churn
- Lower operating costs: Reduce repeat calls, escalations, and wasted agent time
- Better coaching: Give managers concrete data instead of vague feedback
- Compliance monitoring: Document how calls are handled and resolved
The 10 call center performance metrics every operations manager should track
The 10 call center performance metrics below help call center operations managers measure customer experience, workforce efficiency, and agent performance.
1. First Call Resolution (FCR)
FCR measures the percentage of customer issues resolved during the first interaction, with no follow-up or transfer required.
Formula: Number of calls resolved on first contact ÷ Total calls handled x 100
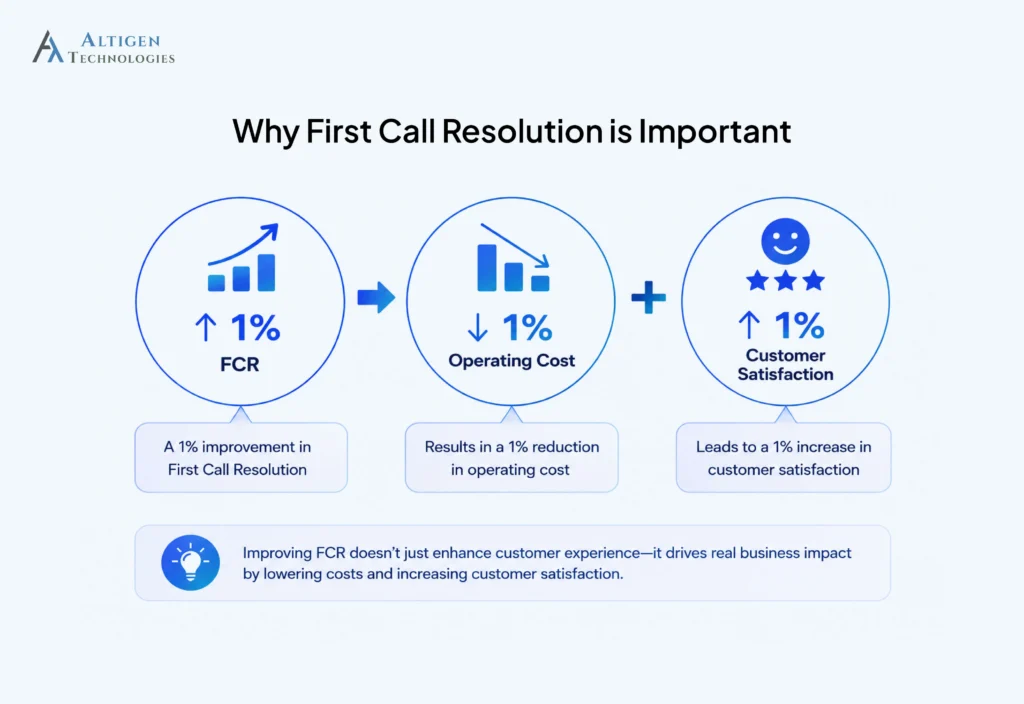
Why it is important: FCR affects both cost and quality at the same time. According to an SQM report, a 1% improvement in FCR results in a 1% reduction in operating cost and a 1% increase in customer satisfaction.
To improve FCR:
- Provide agents with updated knowledge bases.
- Give agents access to customer history.
- Reduce unnecessary call transfers.
- Use skill-based routing to connect customers with the right specialist the first time.
2. Average Handle Time (AHT)
Average Handle Time (AHT) is the total time spent on a call, including talk time, hold time, and after-call wrap-up work.
Formula: (Total talk time + Total hold time + Total wrap-up time) ÷ Total calls
AHT and occupancy move together. Cutting call handle time reduces the time agents spend on calls, so at steady volume occupancy falls and the same headcount now looks overstaffed.
Most call center managers like to reduce AHT but it is not always better. Focusing too much on AHT pushes agents to rush calls that can lower FCR and CSAT at the same time, which usually costs more than it saves. The real goal is to maintain the balance between customer satisfaction and efficient call handling.
Suggested Reading: How Contact Center Software Reduces Agent Handle Time
3. Service Level
Service level measures the percentage of calls answered within a set time threshold.
The industry default is the 80/20 rule: 80% of calls should be answered within 20 seconds. But this benchmark isn’t universal. A financial services line handling account disputes may need a longer, more generous threshold than a retail line handling order status questions.
Some contact centers set service levels around 30 or 60 seconds instead, depending on call complexity and customer expectations. The 80/20 rule is a reference point, not a fixed rule for every queue.
4. Average Speed of Answer (ASA)
Average Speed of Answer (ASA) is the average time it takes for any call to be answered, expressed as a single number (for example, 25 seconds).
A contact center could have a low ASA on average while still missing its service level target if a portion of calls wait far longer than the average suggests. Tracking both metrics helps the call center prevent that inefficiency.
5. Customer Satisfaction (CSAT)
CSAT measures how satisfied a customer felt with a specific interaction. This is usually captured through a short post-call survey.
A few things affect CSAT accuracy:
- Survey timing: Feedback collected immediately after the call is more reliable than feedback collected days later
- Response bias: Customers who had a strongly positive or negative experience are more likely to respond than those with a neutral one
- Relationship with FCR: Resolving an issue on the first call is one of the strongest predictors of a high CSAT score
6. Customer Effort Score (CES)
CES is one of the most underused metrics in call center reporting, even though it has a stronger connection to loyalty and CSAT.
CES measures how much effort a customer had to put in to get their issue resolved, usually on a simple 1 to 5 or 1 to 7 scale. According to Gartner research cited by Interactions, customers who report high effort are 96% more likely to become disloyal, while reducing customer effort can increase repurchase intent by up to 94%.
7. Agent Occupancy Rate
Occupancy measures the percentage of time an agent spends actively handling calls (talking or in after-call work) compared to their total logged-in time.
A good occupancy range is usually around 75% to 85%. Anything consistently higher than this range tends to signal understaffing, which raises burnout risk over time. On the other hand, an occupancy rate below 70% indicates overstaffing, which can increase operational costs.
8. Schedule Adherence
Adherence tracks how closely an agent follows their assigned schedule, including login times, breaks, and after-call work windows. An agent can post excellent occupancy numbers and still damage service level if their adherence is poor.
For example, an agent who logs in 15 minutes late but stays fully busy once online will show strong occupancy numbers, even though the delayed start already created a coverage gap during peak calling hours. Occupancy and adherence should be reviewed side by side, not separately.
9. Agent Quality Score (QA Score)
QA score evaluates how well an agent’s calls meet defined standards for compliance, communication, and problem-solving.
An effective QA program usually includes:
- Scorecards: Structured criteria covering tone, accuracy, and process compliance
- Compliance checks: Confirming required disclosures or verification steps were completed
- Coaching: Turning scored calls into specific, actionable feedback instead of vague notes
- AI-powered quality monitoring: Monitors conversations at scale to identify compliance issues, quality gaps, and coaching needs.
Suggested Reading: How Call Monitoring Software Helps Improve Agent QA in Cloud Contact Center
10. Call Abandonment Rate
Abandonment rate helps businesses track the percentage of callers who hang up before reaching an agent.
Formula: Abandoned calls ÷ Total inbound calls x 100
However, all abandoned calls do not indicate the same thing, so it helps to separate:
- True abandons: Callers who wait past a reasonable threshold and give up
- Short abandons: Callers who hang up within the first few seconds, often unrelated to wait time
- Network disconnects: Dropped calls caused by technical issues rather than customer frustration
A common acceptable benchmark for abandonment rate is under 5%, though queues with more complex issues may have a higher abandonment rate.
How call center KPIs are related
Reviewing metrics one at a time misses the bigger picture. Call center analytics helps managers understand how different KPIs influence one another and where performance problems actually begin. The table below shows how changes in one metric can impact other metrics and affect the business outcomes.
| If this metric changes | It usually leads to | Business impact |
| High AHT | Longer queue times → Higher ASA → Lower service level → Lower CSAT | Higher operating costs and reduced customer satisfaction |
| Low FCR | More repeat calls → Higher call volume → Higher occupancy → Longer wait times | Increased workload and higher support costs |
| High Occupancy | Agent fatigue → Lower QA scores → Higher attrition | Reduced service quality and increased hiring costs |
| Low Schedule Adherence | Fewer agents available during peak hours → Lower service level → Higher abandonment rate | Missed service targets and poor customer experience |
| High Abandonment Rate | More frustrated customers → Lower CSAT → Higher churn risk | Lost revenue and weaker customer loyalty |
Understanding these relationships helps managers trace the actual cause of the problem instead of reacting to whichever number looks worse that week.
Benchmarks for the most important contact center metrics
Use the benchmarks below to compare your contact center’s performance and identify opportunities for improvement.
| Metric | Typical Target |
| FCR | 70% to 80% |
| AHT | Industry dependent |
| CSAT | 80% to 90% |
| Service Level | 80/20 |
| Occupancy | 75% to 85% |
| Abandonment | Under 5% |
These figures can be taken as references, not fixed rules. A healthcare line handling insurance questions may have longer AHT than a retail line handling order tracking, but that difference doesn’t mean either contact center is underperforming.
Common mistakes to avoid when tracking call center performance metrics
Even well-run contact centers fall into a few recurring traps:
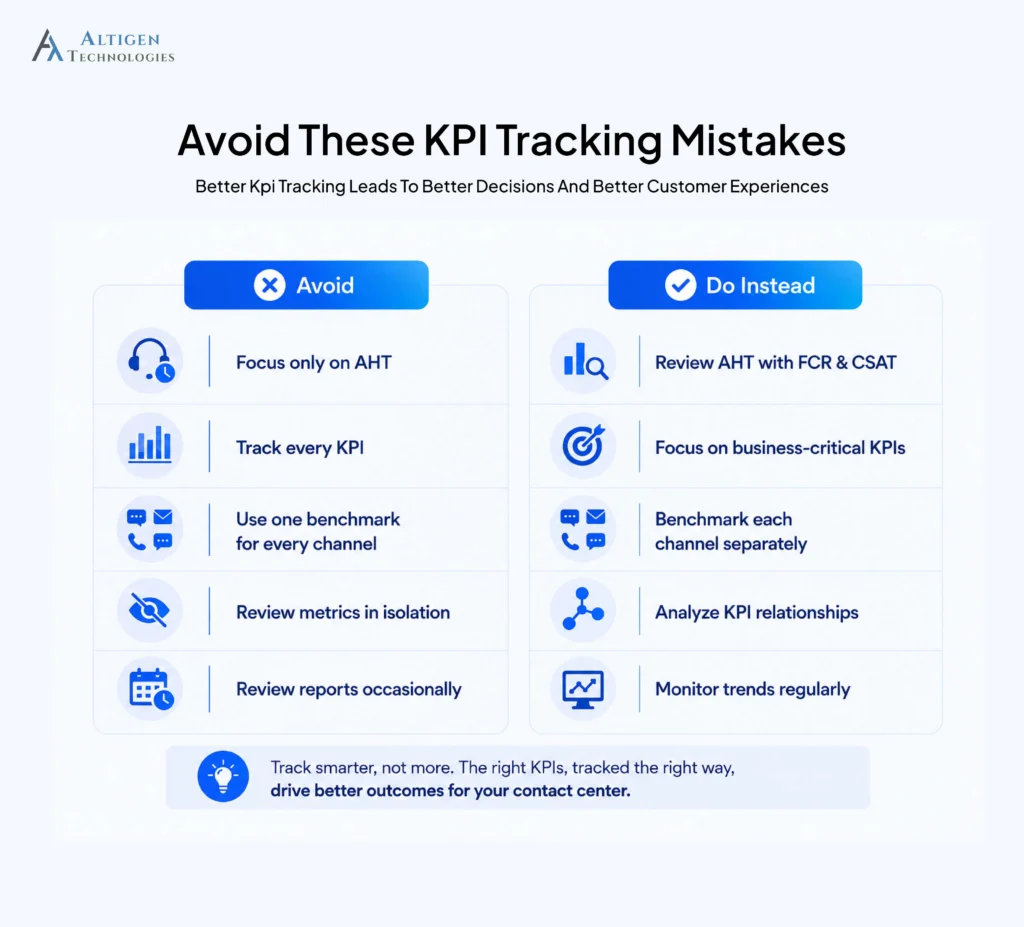
- Using AHT as the only productivity metric: This puts pressure on agents to rush calls, which quietly lowers FCR and CSAT.
- Ignoring customer effort: A call can resolve successfully and still leave the customer frustrated by how hard it was.
- Tracking too many KPIs: Focus on the metrics that align with your business goals instead of monitoring every available KPI.
- Comparing different channels using same benchmark: Phone, chat, and email have different handle times and shouldn’t be judged against one scorecard
- Not reviewing KPIs regularly: Performance metrics only bring improvement when they are reviewed consistently.
- Not reviewing metrics together: Treating FCR, occupancy, and adherence as separate metrics instead of connected ones.
Final takeaway
Tracking call center performance metrics is useful if the insights lead to better decisions. Reviewing metrics such as FCR, Service Level, AHT, CSAT, and agent occupancy together gives operations managers a clearer picture of customer experience, workforce efficiency, and overall contact center performance.
If you’re looking for contact center software that helps you track these metrics in real time, the Altigen contact center solution provides that. Its AI-powered analytics, customizable dashboards, and quality management help you monitor performance, improve agent productivity, and deliver exceptional customer experiences.
Contact Altigen to explore call center software that helps you turn performance data into measurable business results.
Frequently asked questions
Call center performance metrics are measurable indicators, such as FCR, AHT, and CSAT, used to track how efficiently and effectively a contact center resolves customer interactions.
First Call Resolution is often considered the most important single metric because it reflects both cost efficiency and customer satisfaction at the same time.
Call center KPIs usually focus on voice interactions alone, while contact center metrics cover performance across every channel, including chat, email, and social media.
Real-time metrics like service level and abandonment rate should be checked daily, while trend-based metrics like attrition and CSAT are better reviewed weekly or monthly.
AI can score more calls for quality than manual review allows, flag compliance risks in real time, and forecast staffing needs before service levels start to slip.